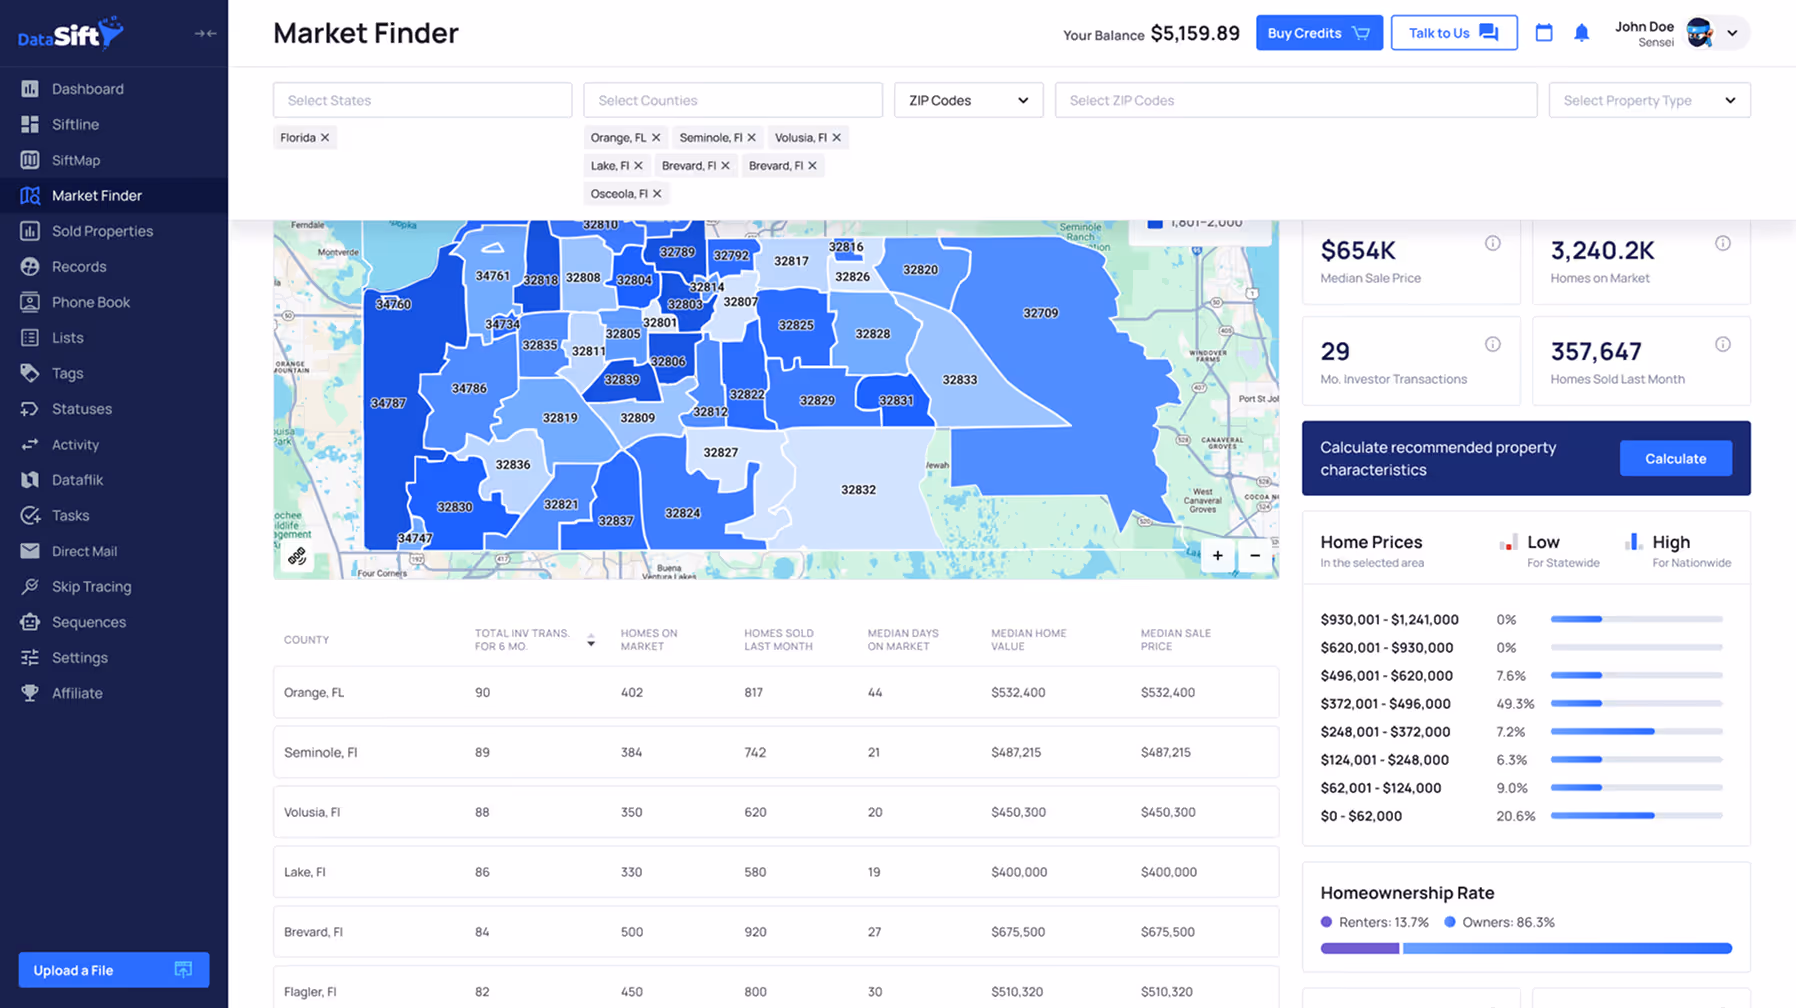
Confident Market Selection
Step 1: Input Your Market
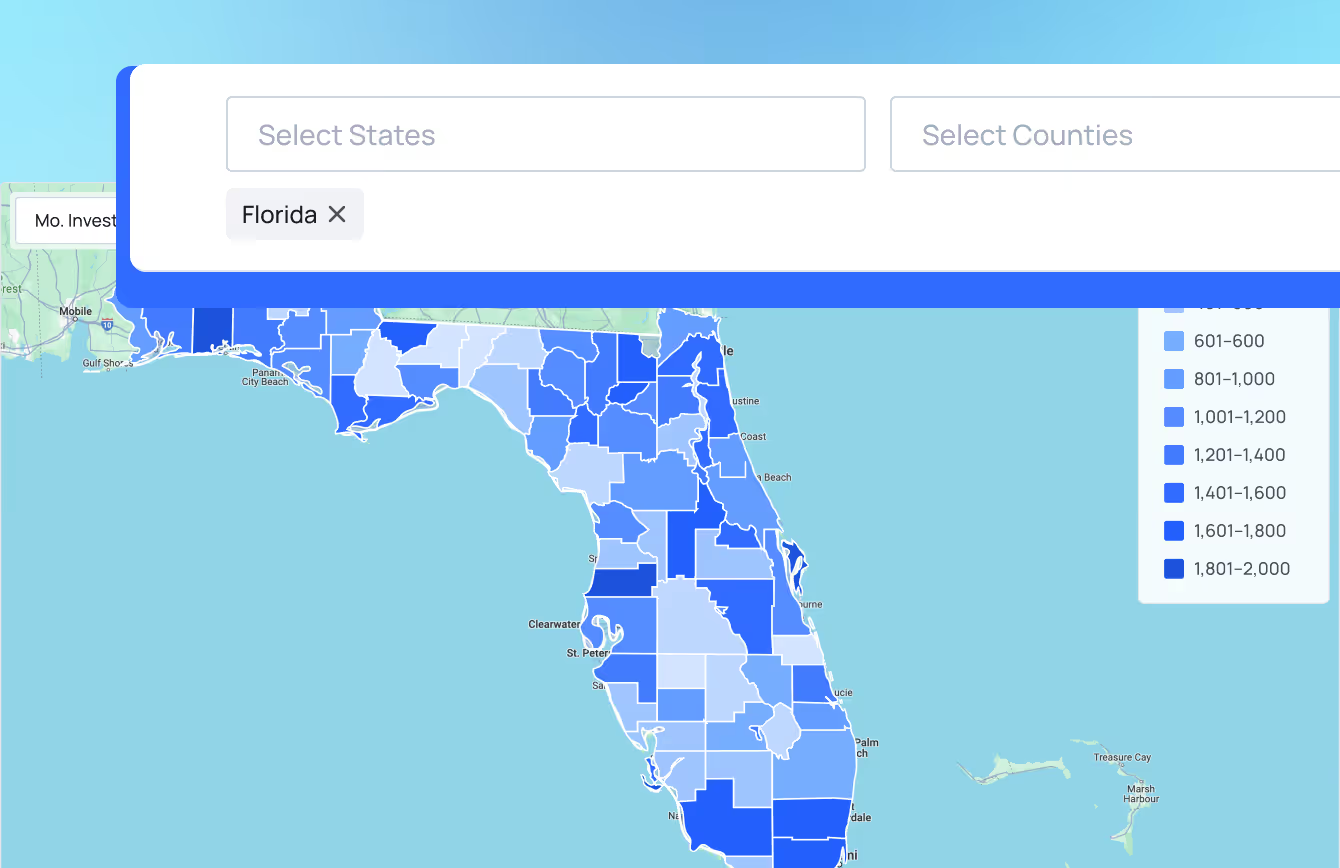
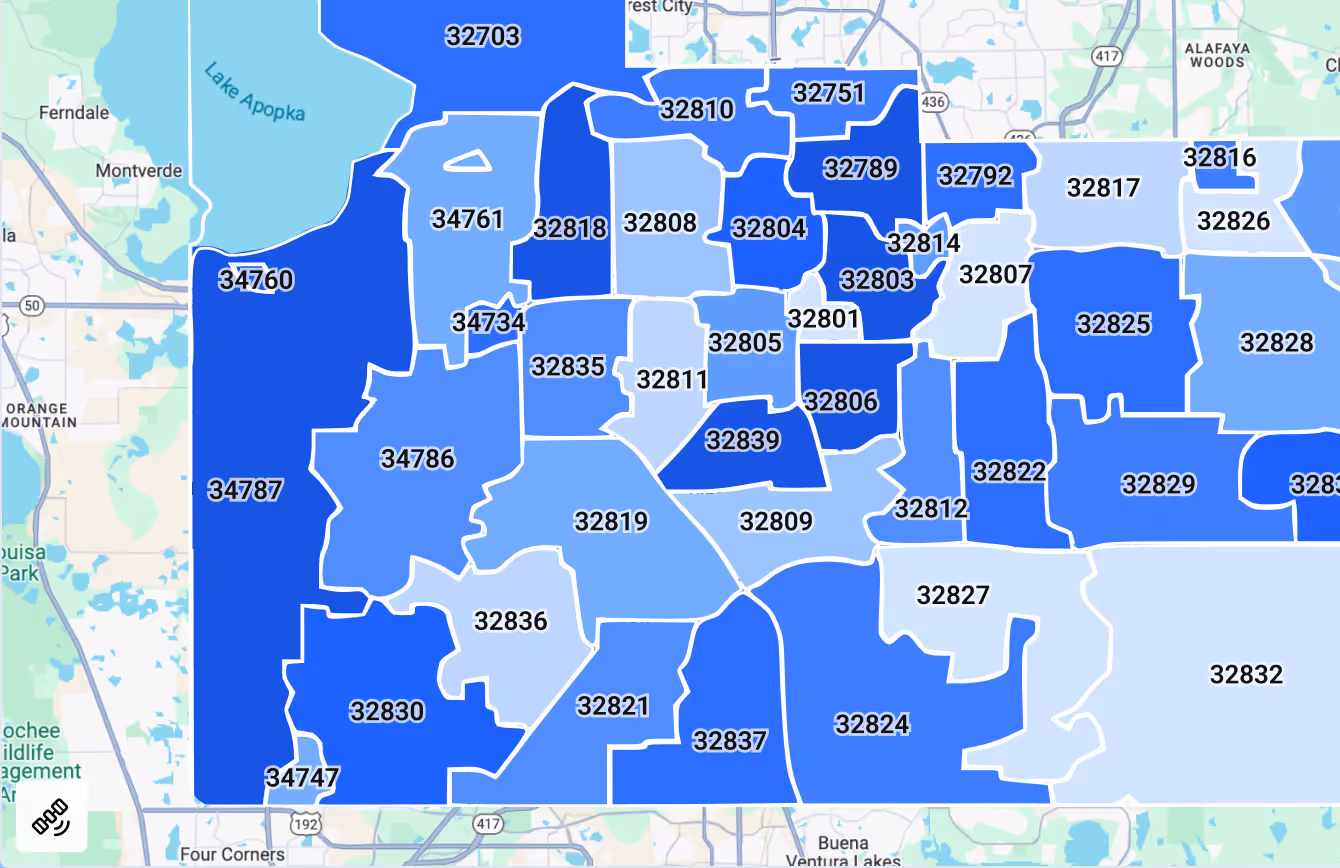
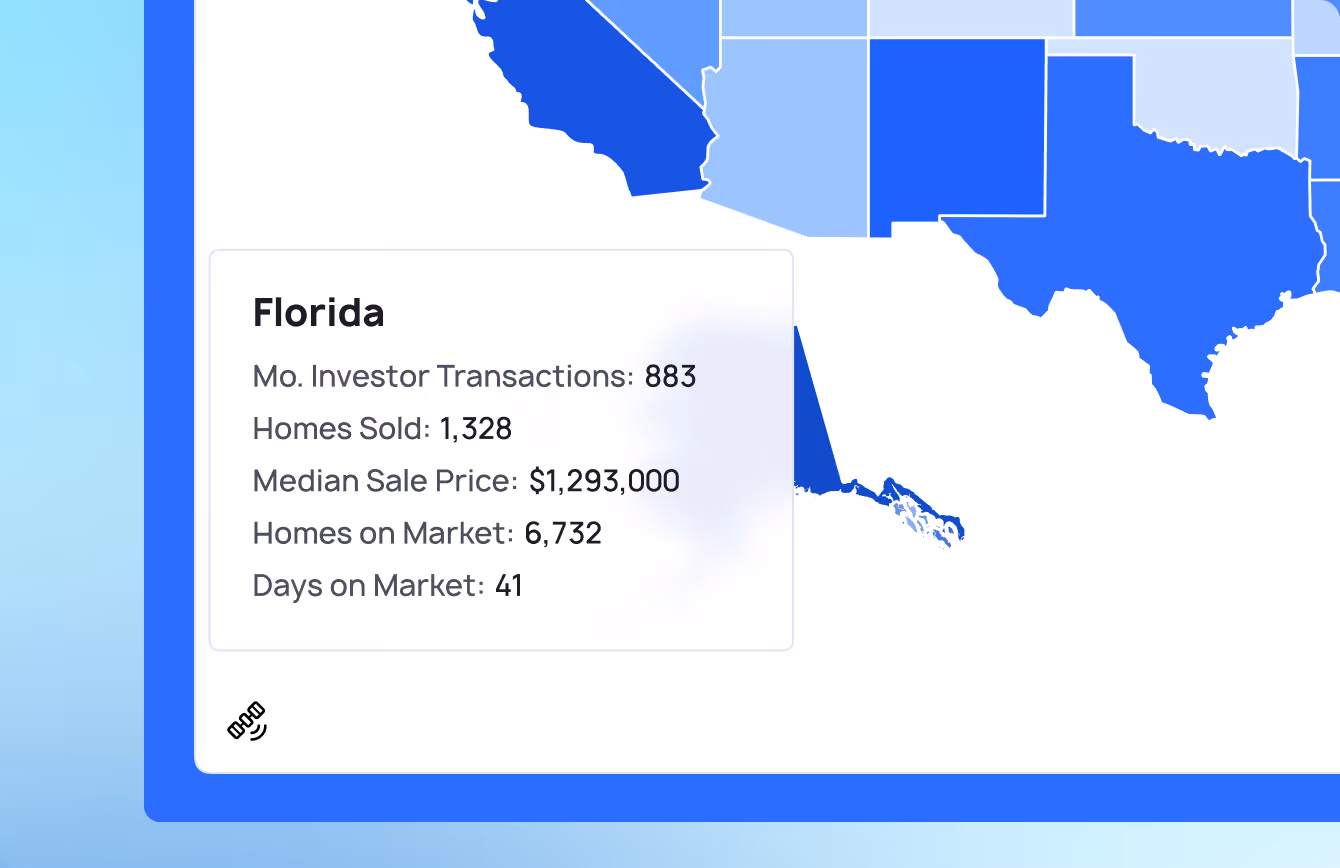
Select your state and county. The tool displays a color-coded heatmap of that area.
Step 2: See the Heat
Darker colors = more investor activity. Lighter colors = dead zones. You instantly see which ZIP codes are producing deals and which aren't.
Step 3: Drill Down Deep
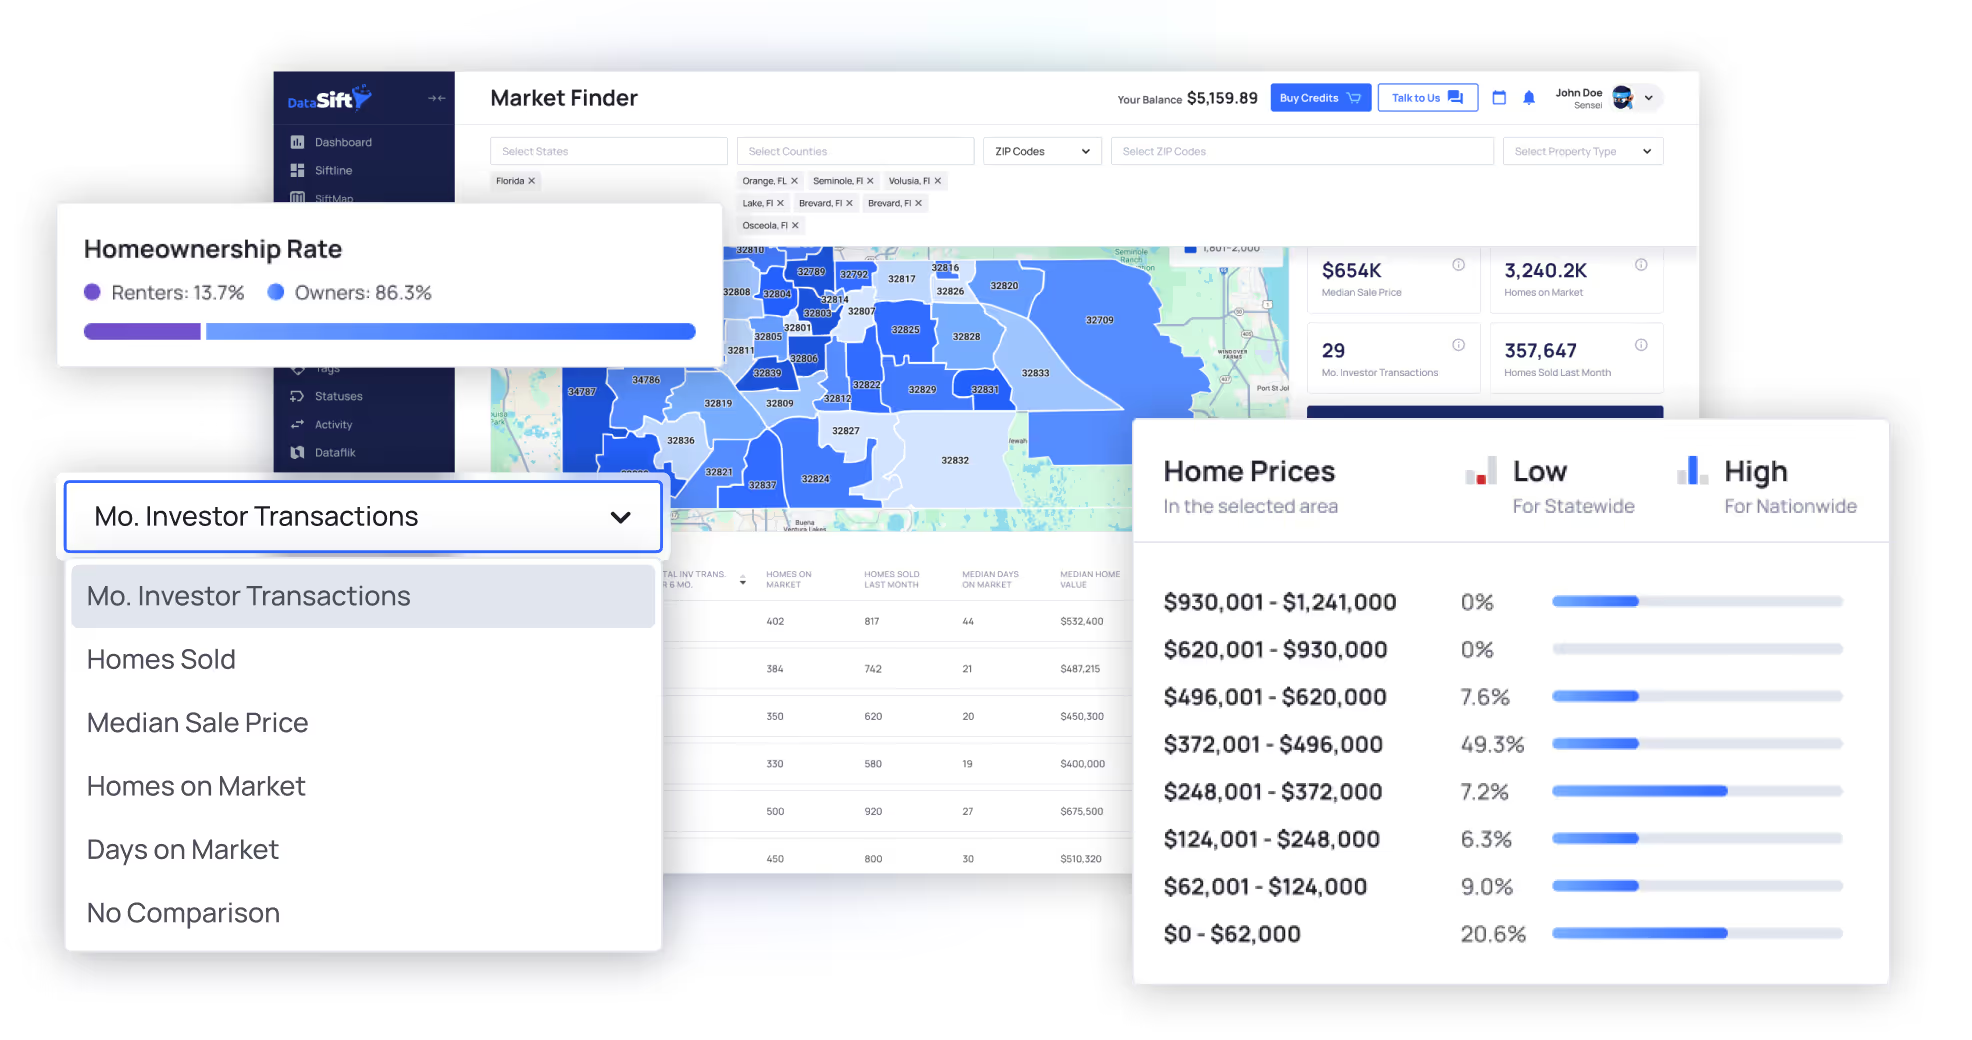
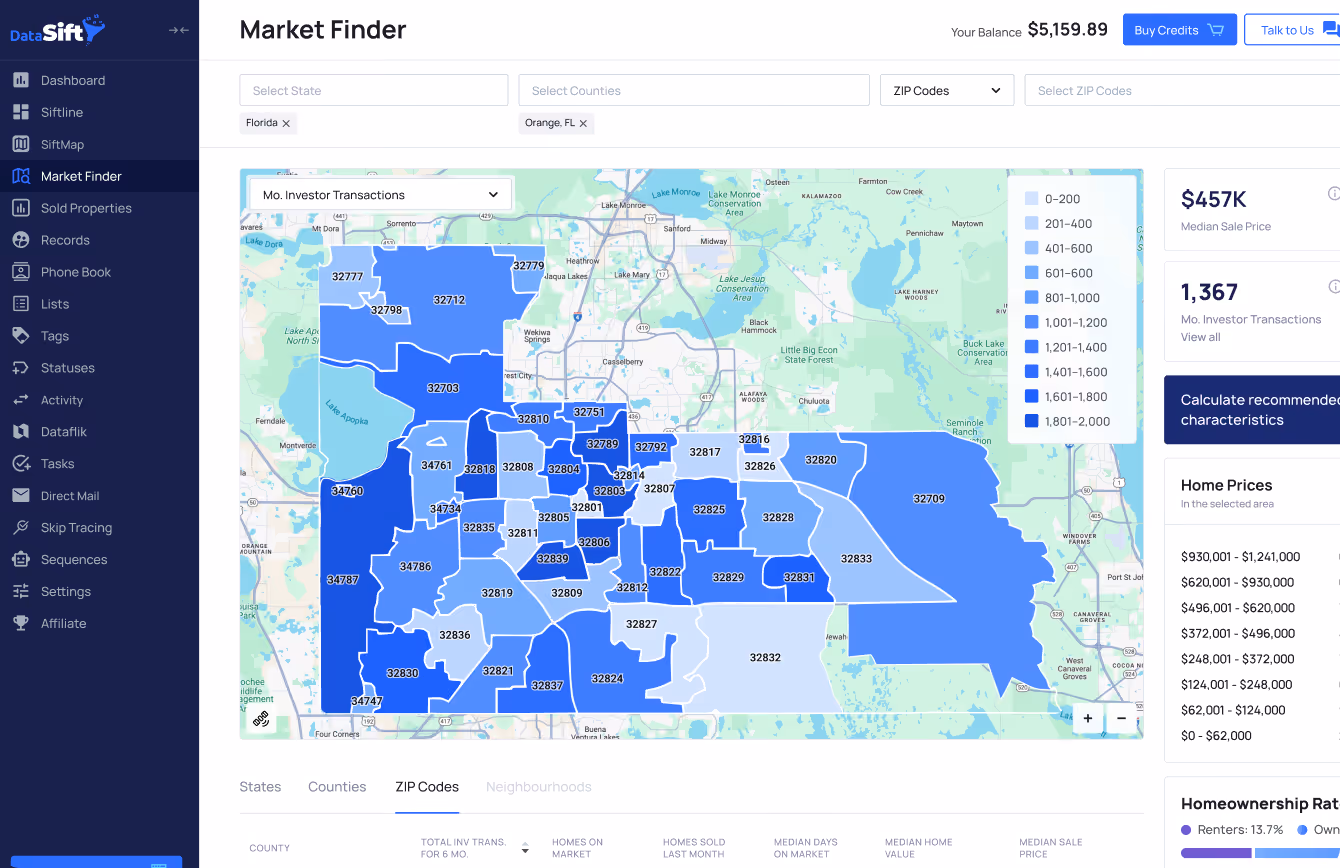
Toggle between metrics:
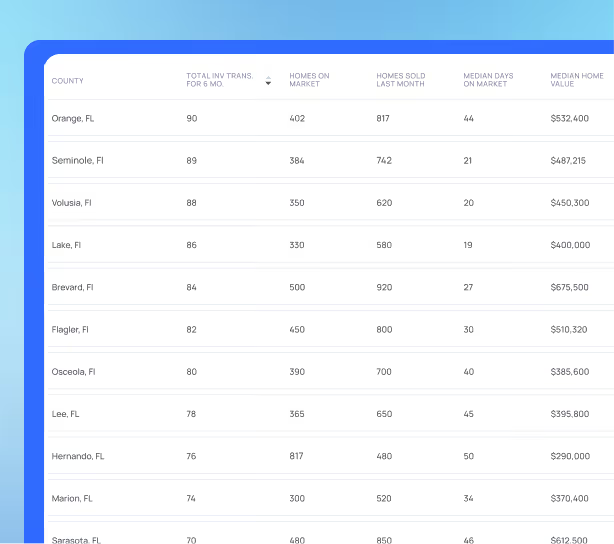
- Investor purchases (last 6 months)
- Total home sales
- Median prices
- Days on market
- Inventory levels
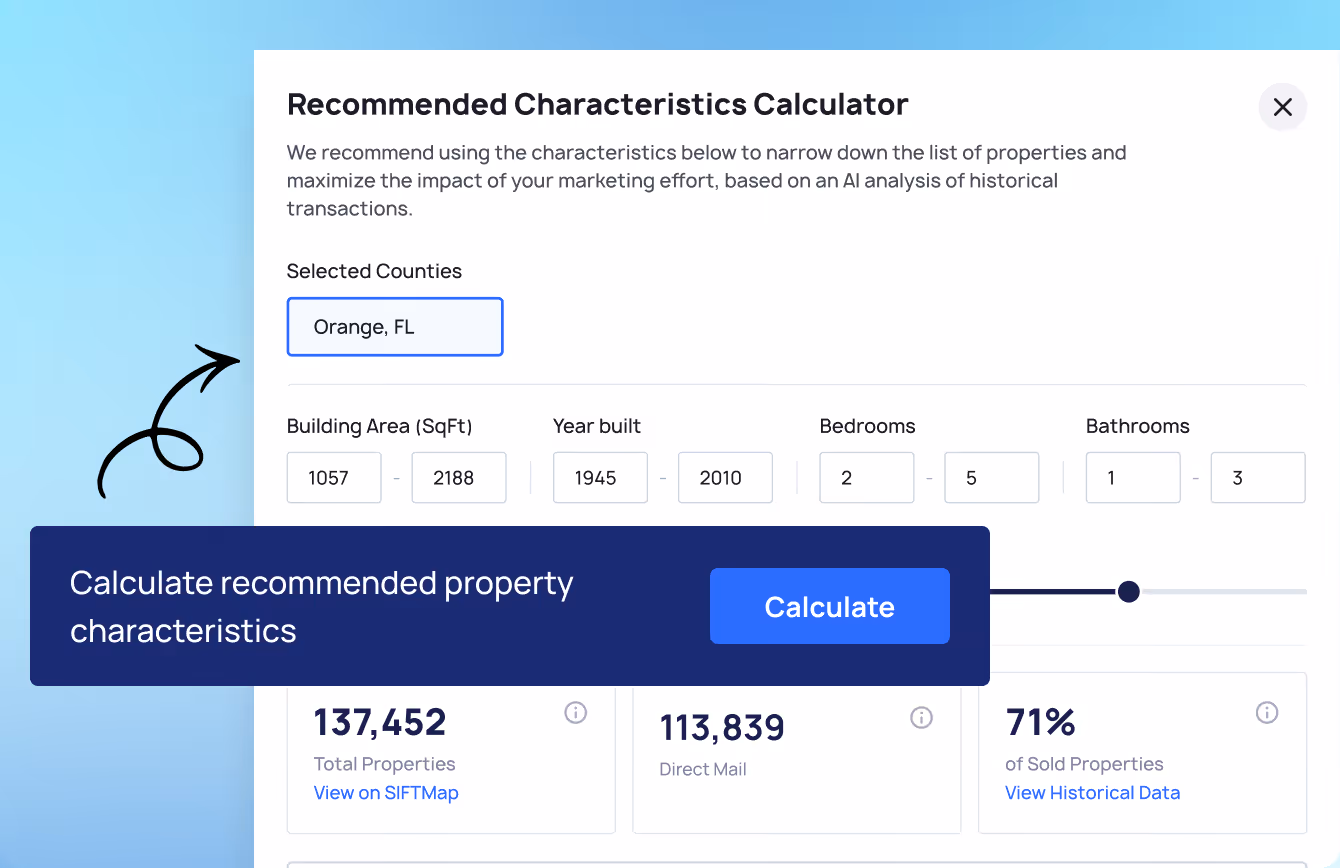
Step 4: Get Your Buy Box
Click "Calculate Recommended Filters" and the system analyzes all investor deals in your chosen area. It spits out the common traits: "Most deals were 3BR single-families, built 1950-1990, under $250k."
Step 5: One-Click List Building
Hit "View on SiftMap" and those exact filters auto-apply. You get a targeted list of properties in hot ZIPs that fit the proven pattern—ready for marketing.
More Profit. Less Spend
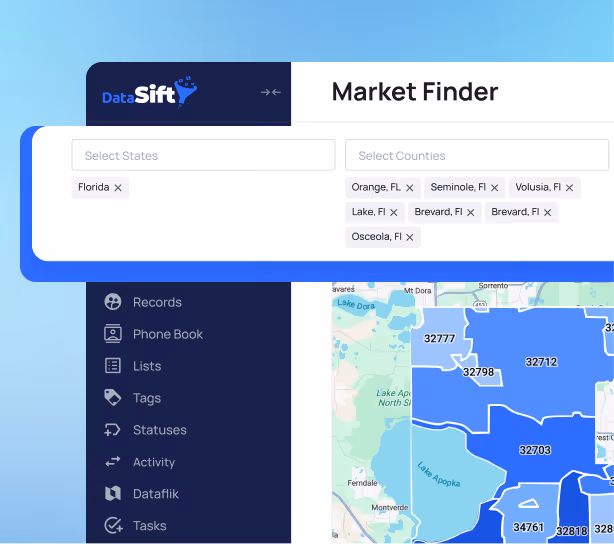
Navigate at the nationwide, state, county, zip code, and neighborhood level.
Use the "magic number" of 10 or more monthly average investor transactions to identify high-performing areas.
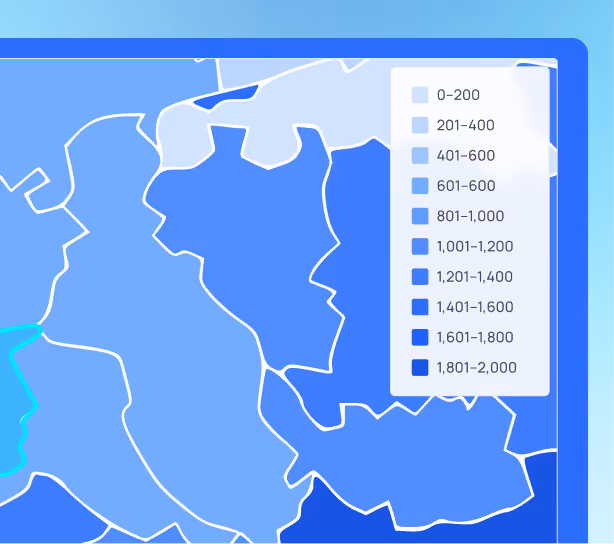
The darker the map area, the higher the volume of activity.
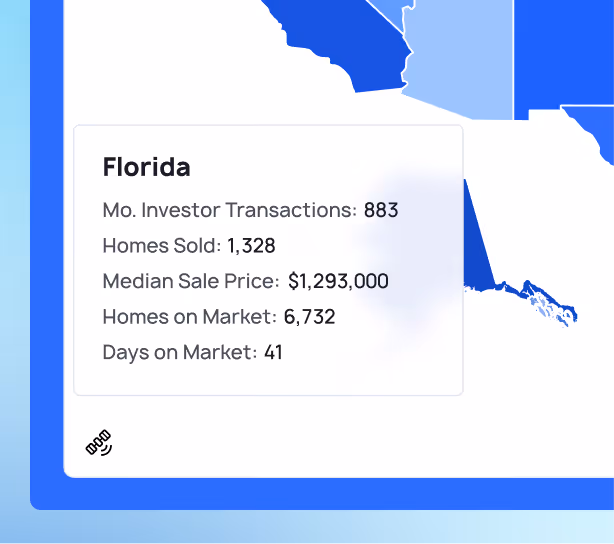
Get a clear understanding of how active a market is by looking at homes on market and days on market.
Proven Results: Real Case Studies


The DataSIFT team want to just hop on here and thank you for the release of SIFTMAP. The not having to go back and forth between PropStream or PropWire and any of these other platforms, just to get basic info is a huge advantage. Saving me an extra couple hundred bucks a month, and that way I can put it towards more direct mail in the system, as well as obviously saving a bunch of hours every week and just focused on revenue generating stuff.
John Ramos
DataSift User
Free Training!
Learn just how fast you can start generating leads in targeted areas!