

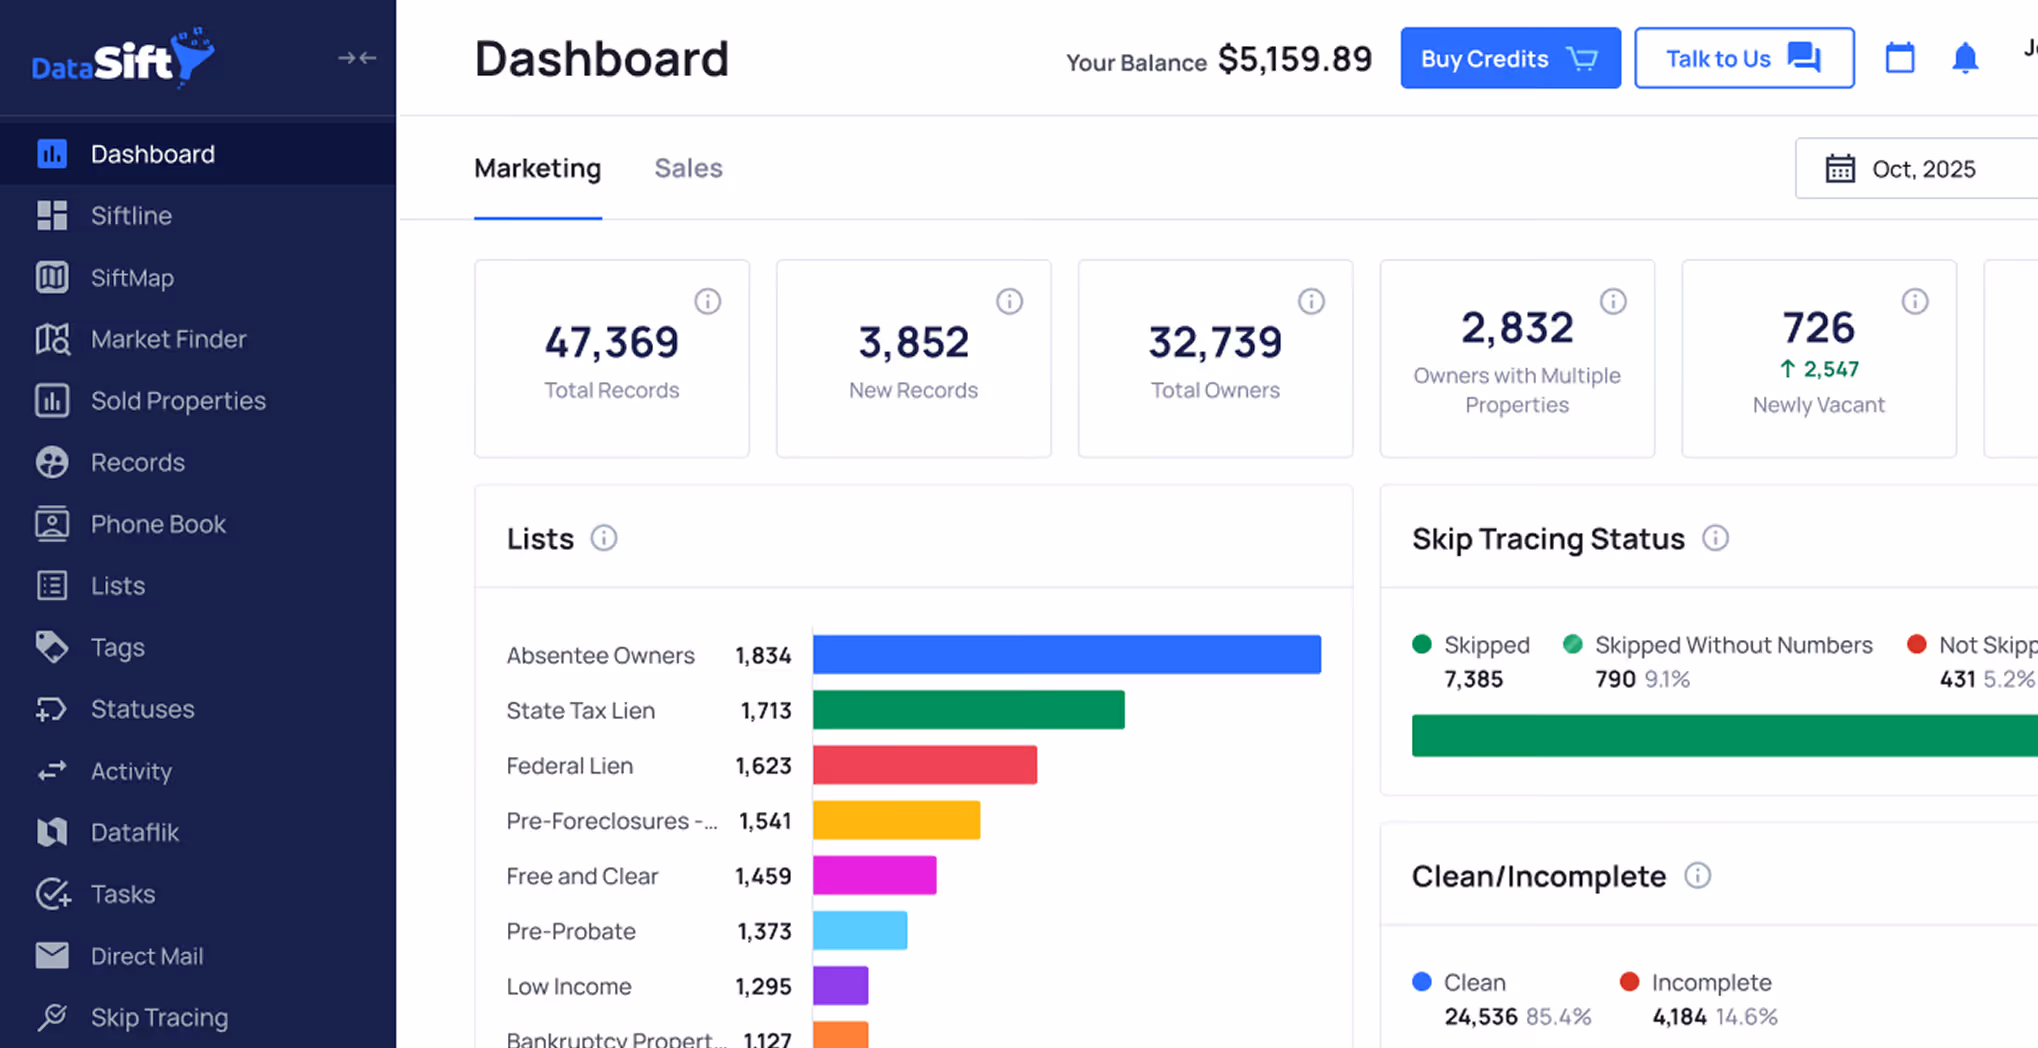
What Are Sift Dashboards?
Dashboards give you a real time performance view of your entire business.
Instead of manually compiling reports across leads, contacts, tasks, and deals, dashboards automatically surface your most important KPIs in one place.
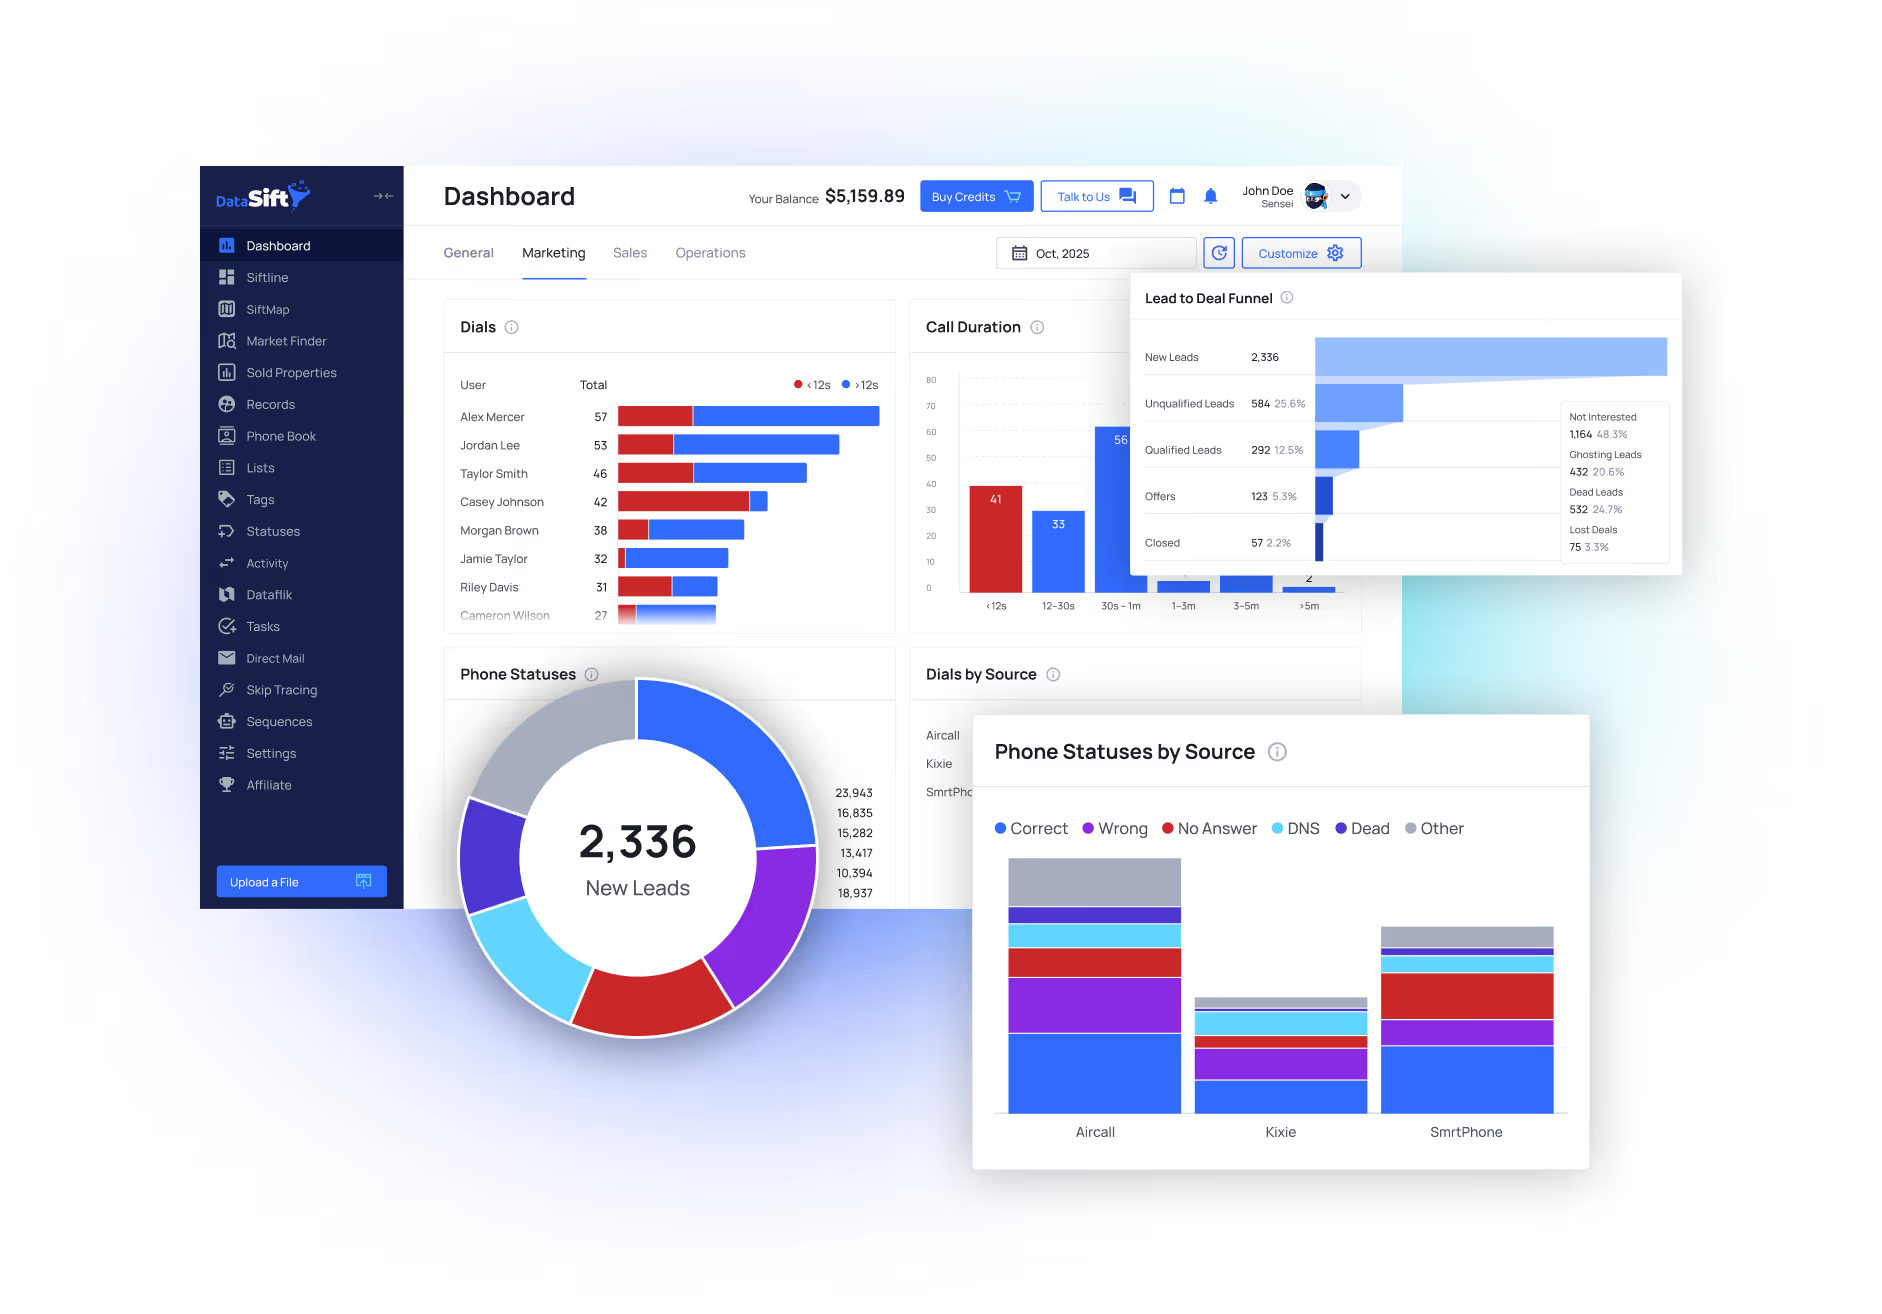
Each dashboard contains multiple report widgets that visualize your CRM activity using charts, tables, and KPI metrics.
See your business performance instantly:
- Leads generated
- Conversion rates
- Tasks completed
- Offers submitted
- Active contracts
- Closed deals
Every metric is calculated directly from your CRM data so you always know exactly how your business is performing.
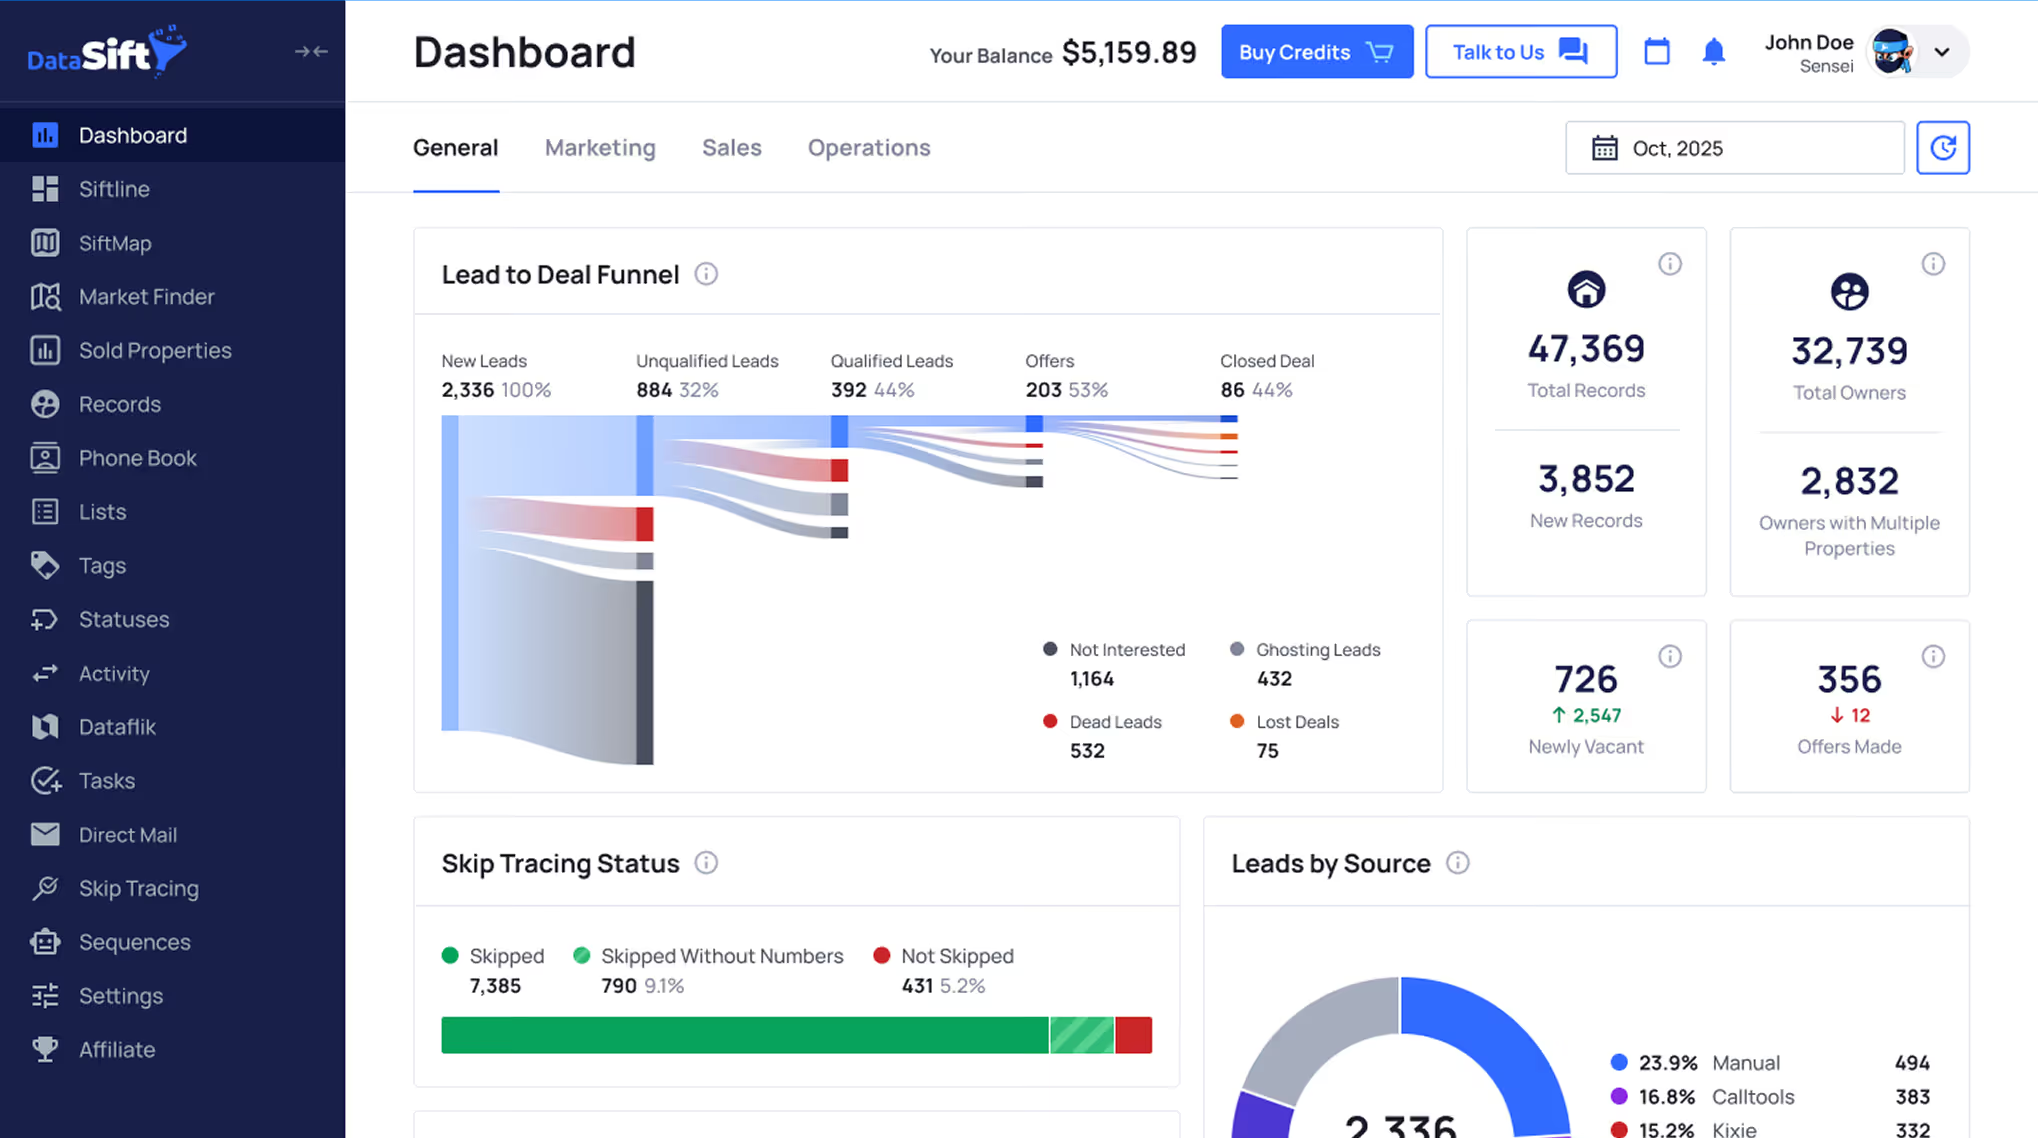
How Dashboards Work
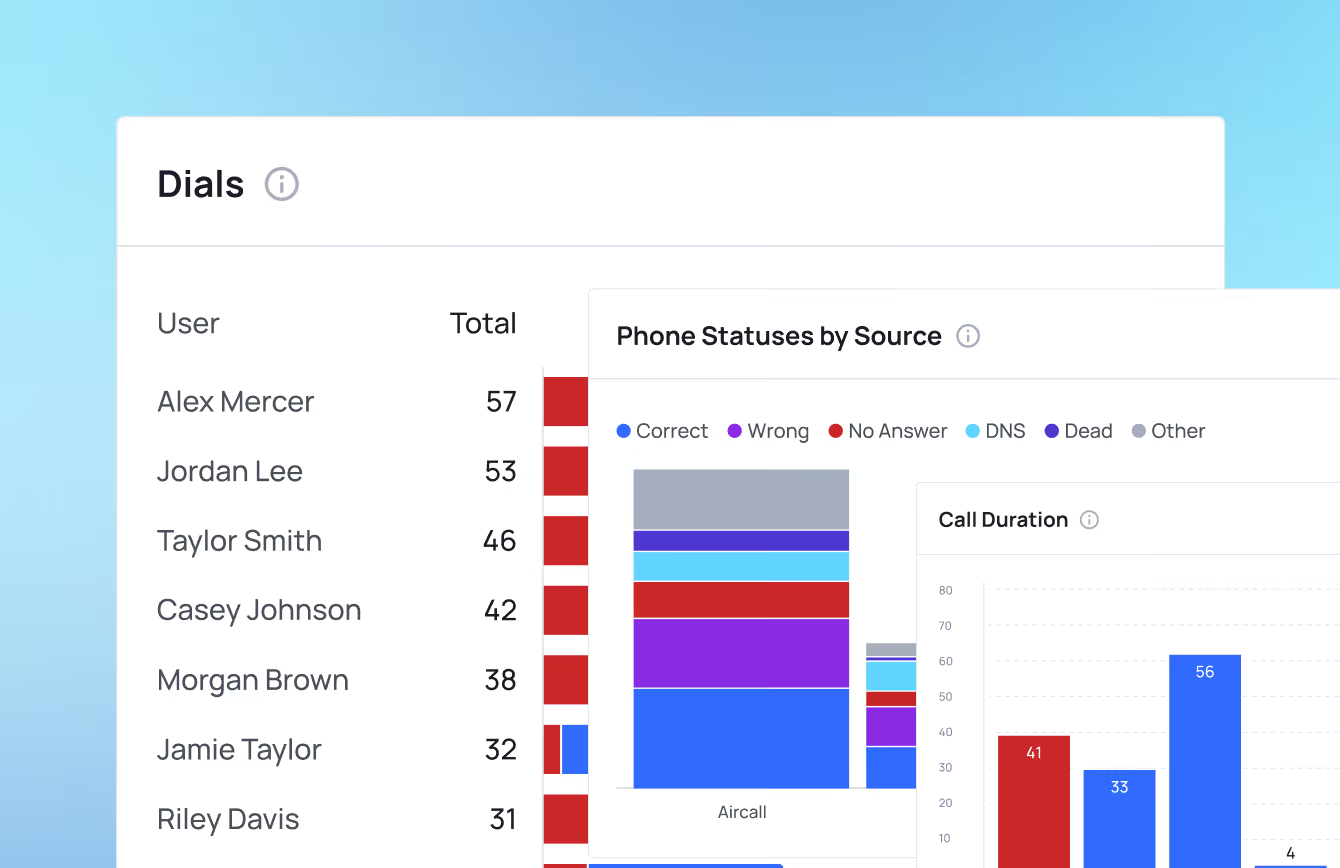
Each tab contains multiple KPI widgets showing real-time performance metrics.
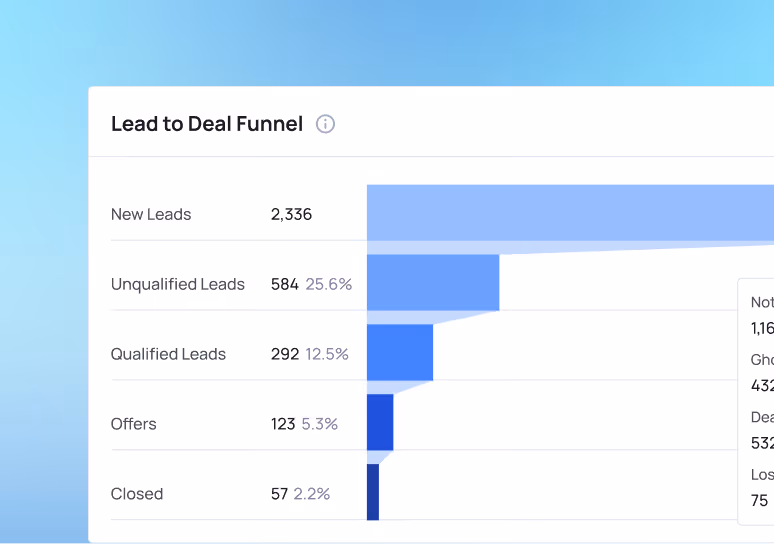
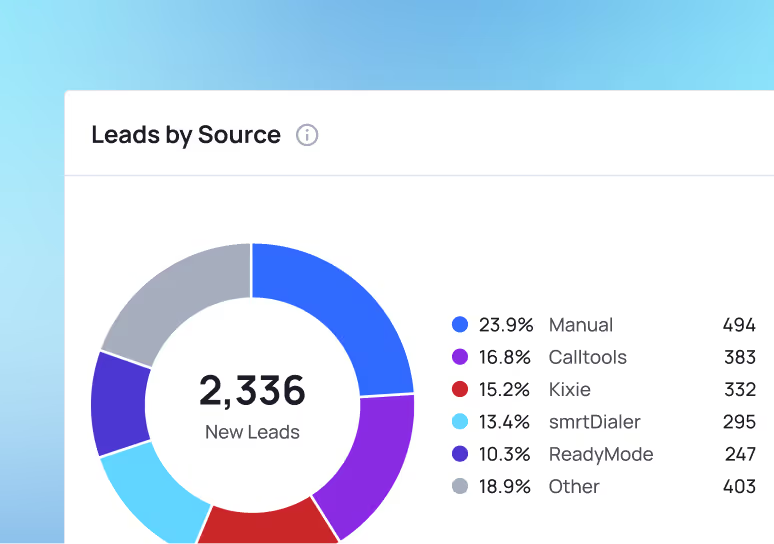
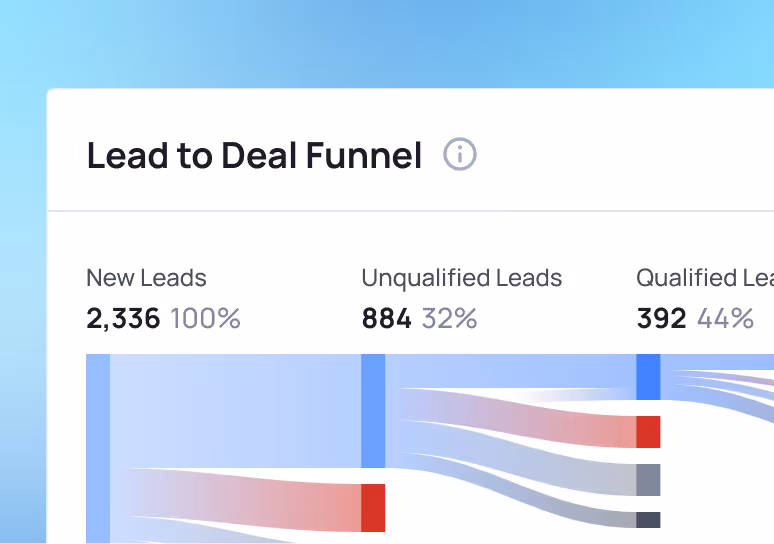
Lead Management
Track how leads move through your pipeline.
- New leads created
- Lead qualification rates
- Conversion performance
- Lead source breakdown
Contact Statistics
Understand how your contact database is growing and performing.
- Contact growth
- Owner vs property insights
- Engagement trends
- Contact activity metrics
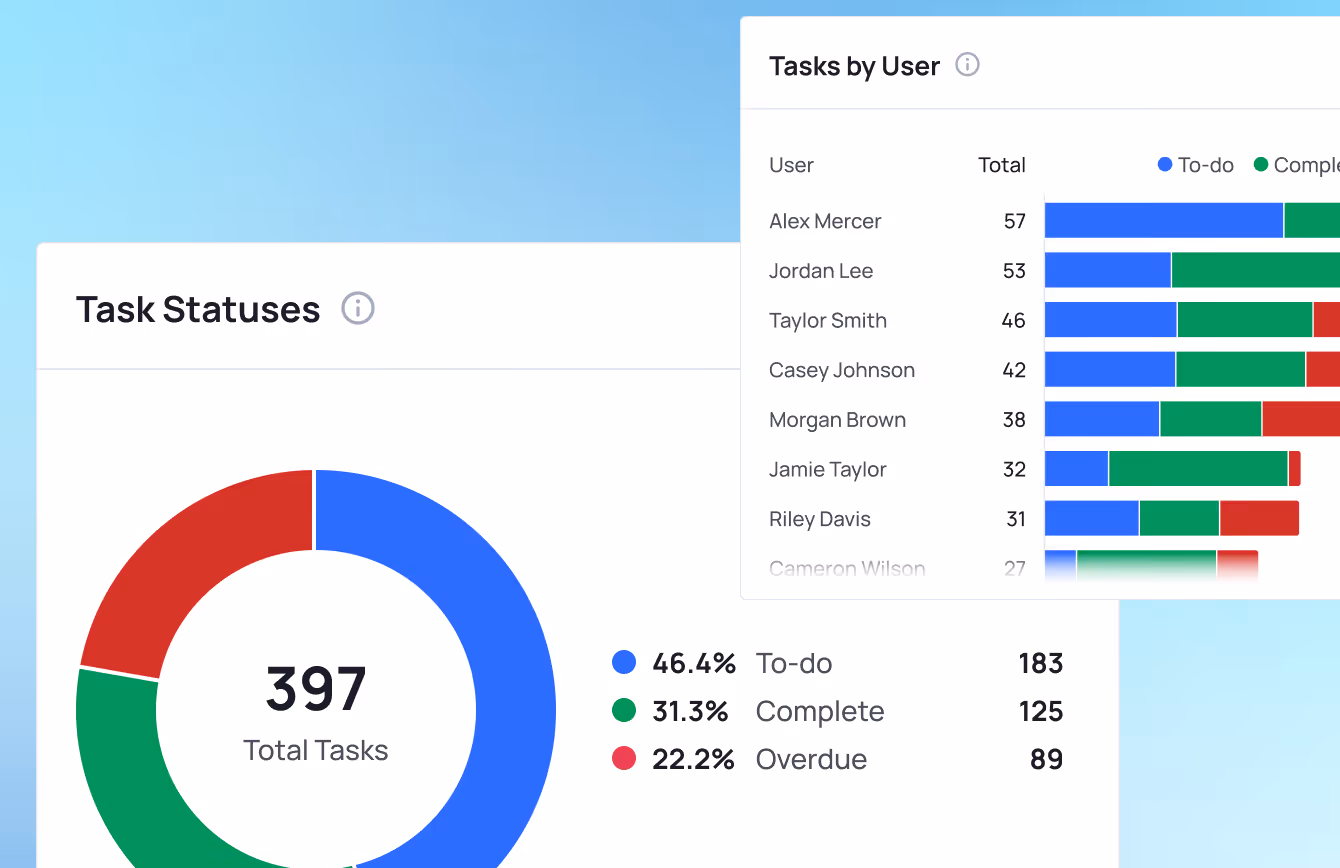
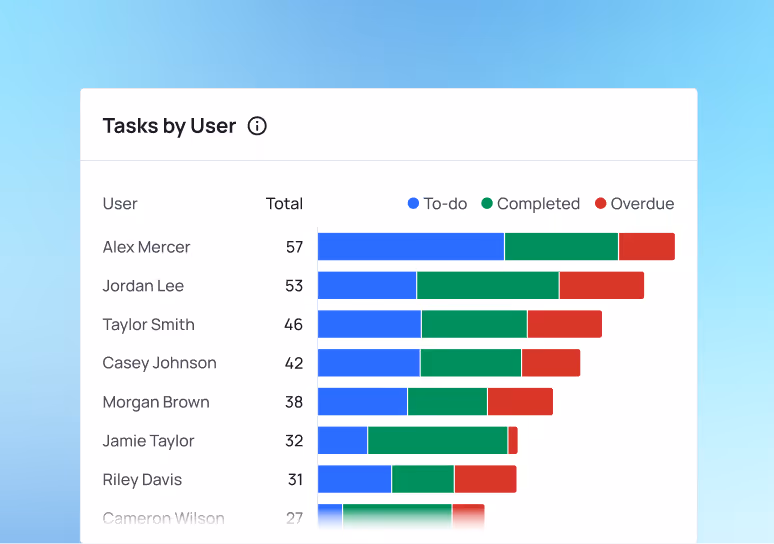
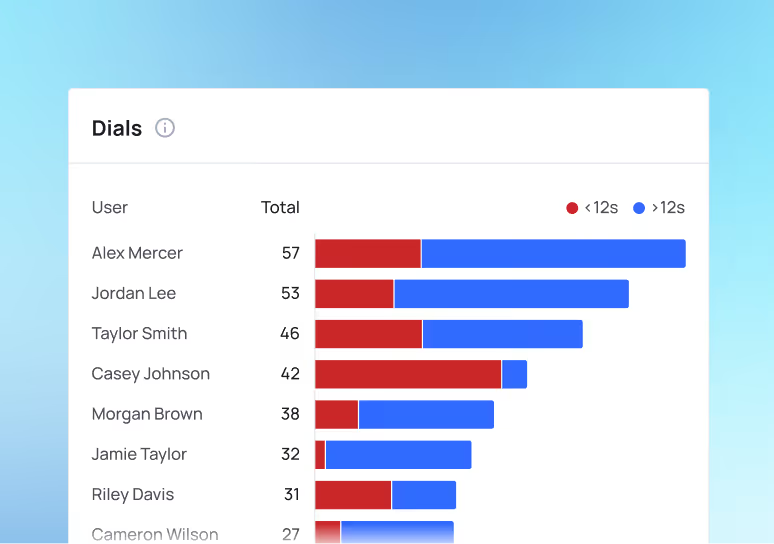
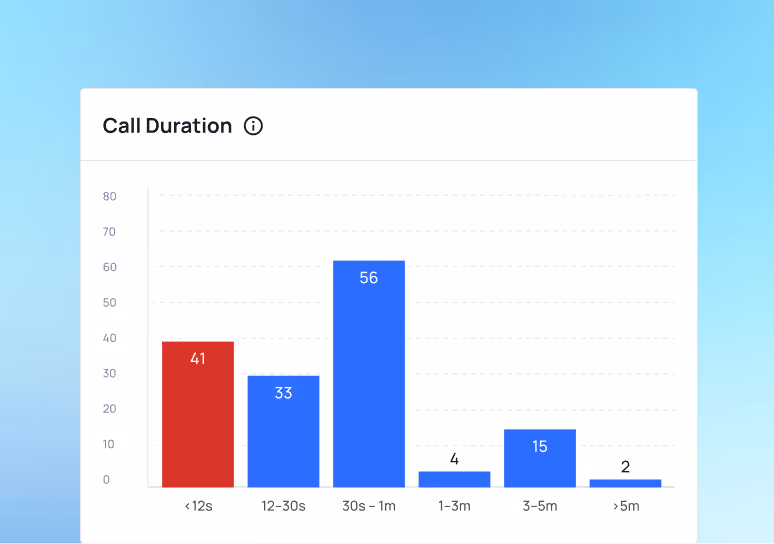
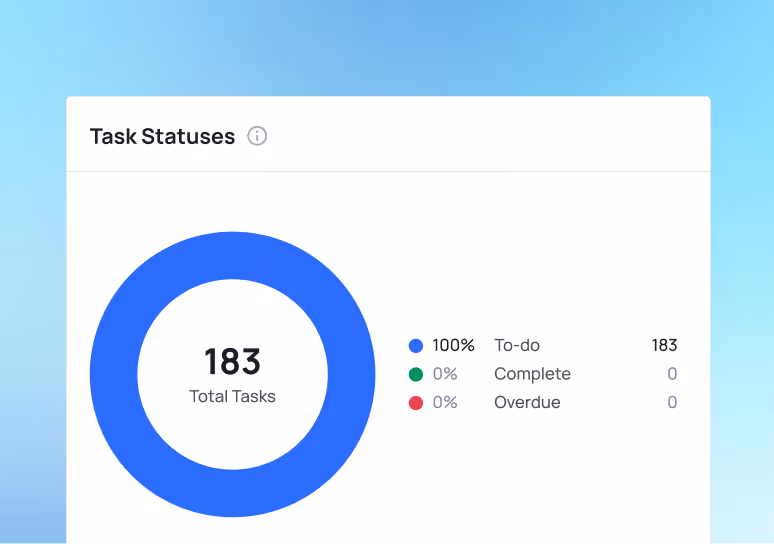
Tasks
Monitor operational performance across your team.
- Tasks completed
- Tasks overdue
- Task completion by user
- Team productivity metrics
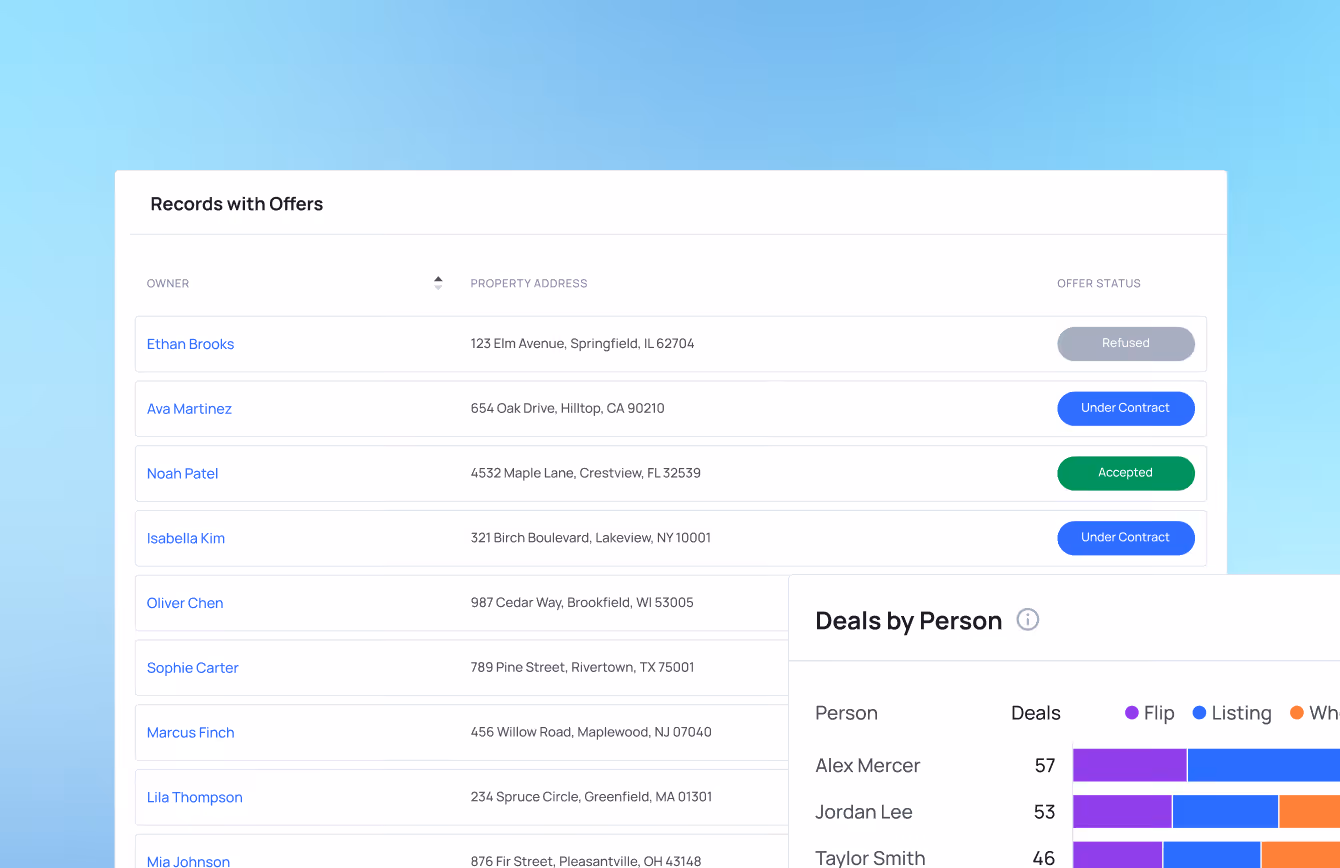
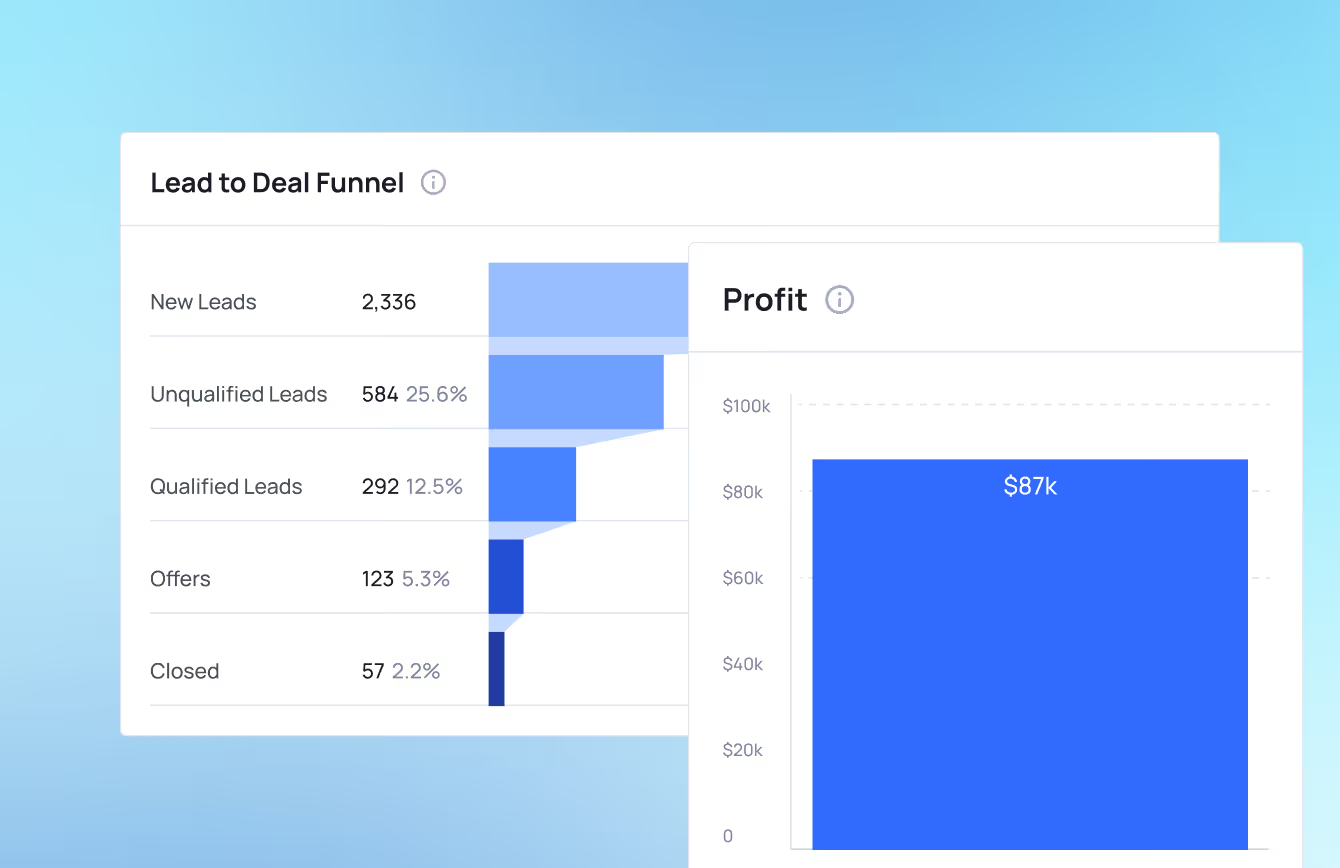
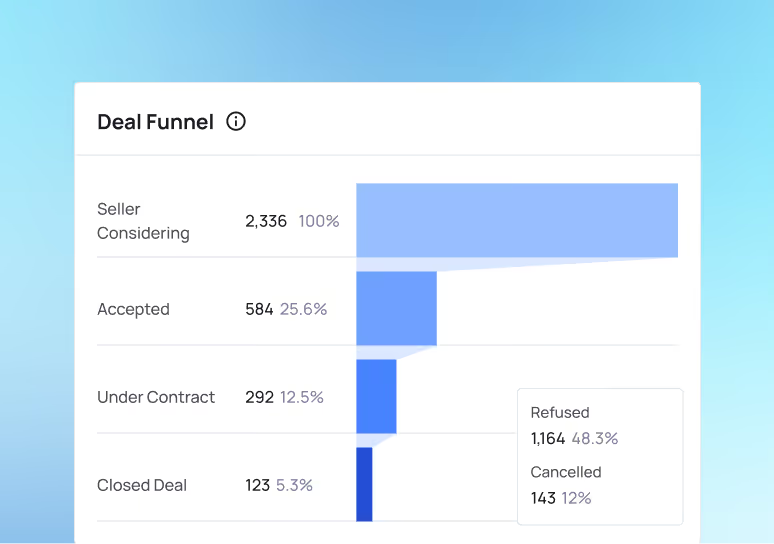
Offers & Deals
Track deal flow across your pipeline.
- Offers submitted
- Active contracts
- Closed deals
- Revenue performance
Visual KPI Reports
Each dashboard displays data using easy-to-read report formats.
These reports allow you to quickly identify trends and performance changes across your business.
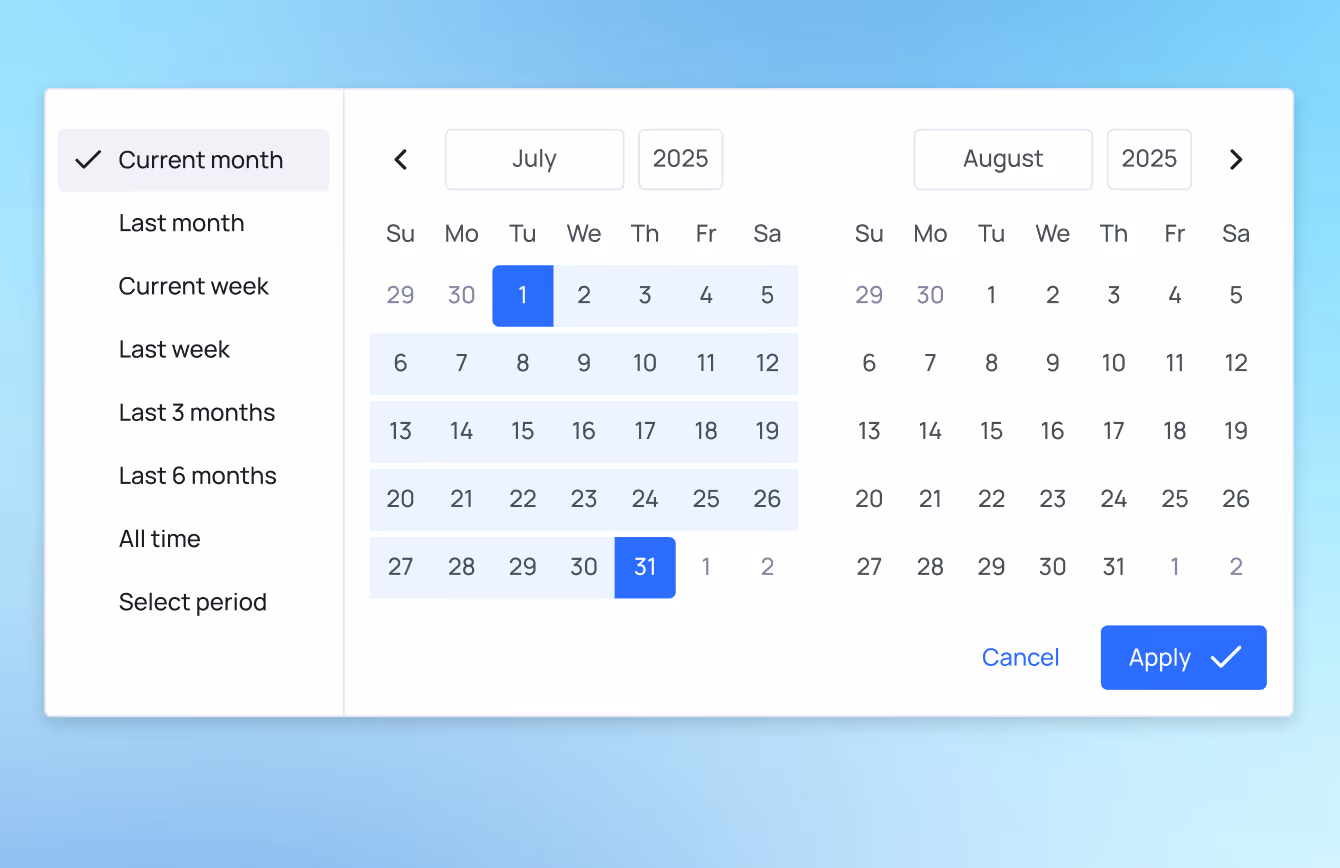
Analyze Performance Over Time
Dashboards include a global period selector so you can instantly analyze performance across different timeframes.
Every report automatically updates based on the selected timeframe.
Why Do You Need Dashboards?
Most real estate investors operate without clear visibility into their business performance.
Leads are coming in.
Tasks are being completed.
Deals are moving forward.
But there’s no clear view of what is actually working.
Dashboards turn your CRM data into actionable business intelligence.
Know Your Numbers

Improve Team Performance
Prevent Deals From Falling Through
Run Your Business With Data
Proven Results: Real Case Studies


The DataSIFT team want to just hop on here and thank you for the release of SIFTMAP. The not having to go back and forth between PropStream or PropWire and any of these other platforms, just to get basic info is a huge advantage. Saving me an extra couple hundred bucks a month, and that way I can put it towards more direct mail in the system, as well as obviously saving a bunch of hours every week and just focused on revenue generating stuff.
John Ramos
DataSift User
Free Training!
Learn just how fast you can start generating leads in targeted areas!


.avif)


